Multiple Forces Graph
Using the Multiple Forces Graph
This article covers the functionality present in 10.0 and up.
Applicable software variants: Motion Catalyst & Swing Catalyst.
Versions: 10.0 - 10.2
Available for Data-Centric and Detailed Data Layouts only.
Required hardware: Force plate(s) / Motion Plate / Dual Motion Plate, or recording with force data.
Which version of the software am I using?
Related articles:
Multiple Forces Graph Databox
The multiple forces graph databox is a databox that has new some new functionality.
It still behaves the same as existing graphs, you can interact with the graphs the same way (see article above, “Using the new graph library” for details.
Noticeable features are:
Combined data view, all force data in one databox.
Value annotation when clicking the graph, annotation follows the mouse cursor.
Ability to toggle the visibility for each source.
Your source selection is remembered individually for both the Data Centric and Detailed Data layouts respectively.
Supports phase highlighting.
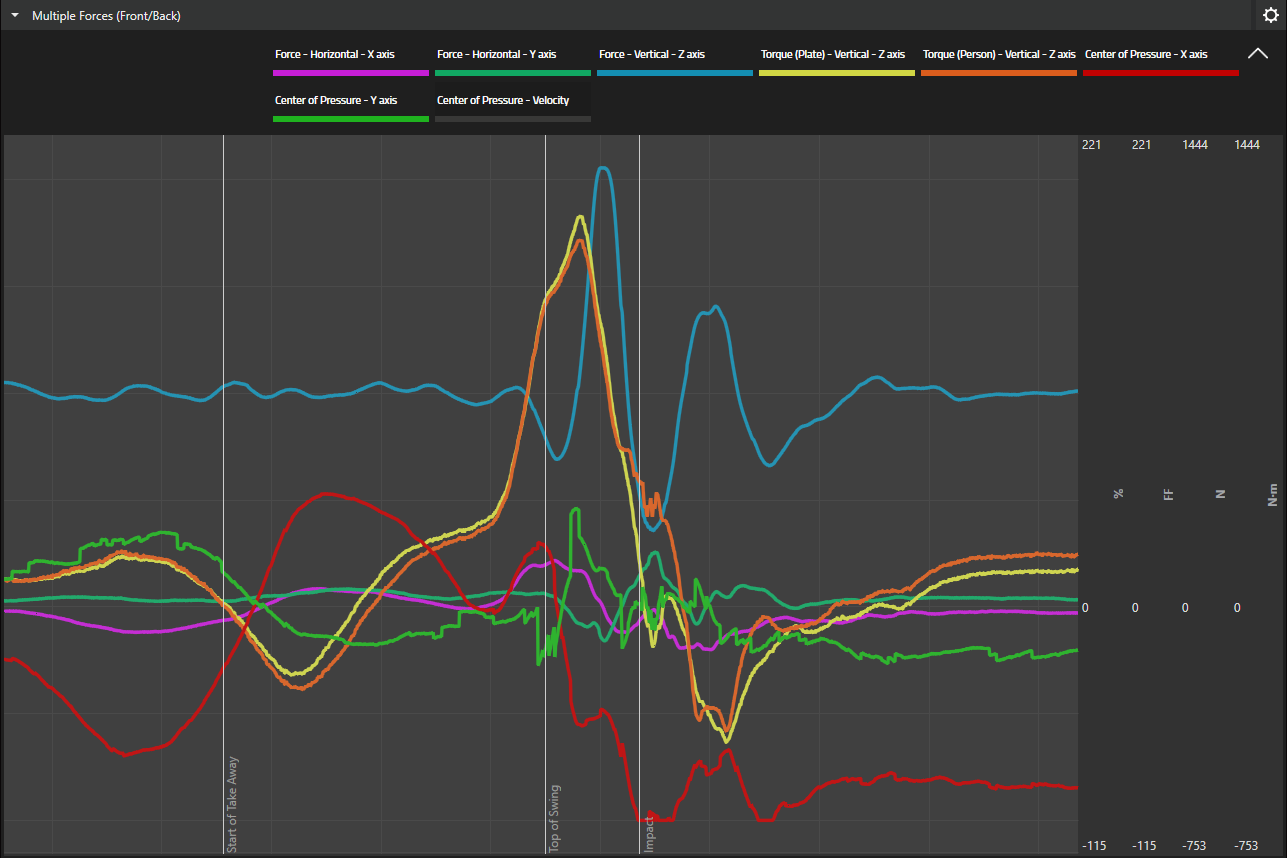
Example of the multiple forces databox in the Detailed Data layout
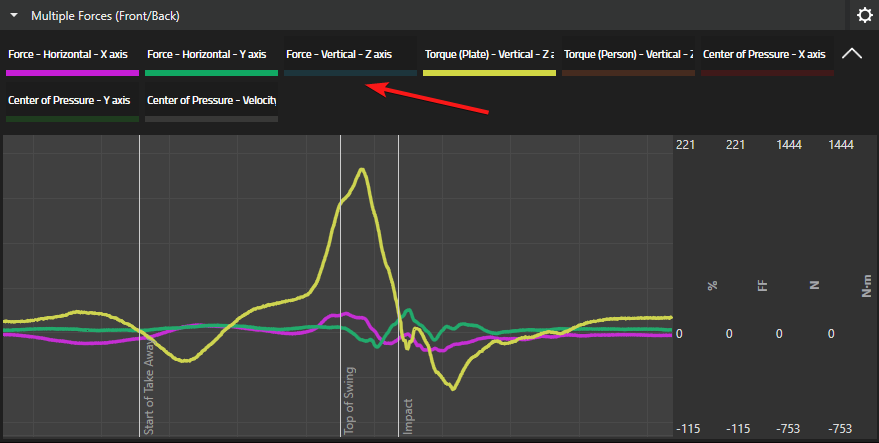
Example from the Data Centric Layout:
Note some sources are de-selected. The visibility can easily be changed by toggling it from the menu highlighted by the red arrow.
Sources that are turned off will have a muted color compared to those that are enabled.
Value annotation
Clicking each graph will show an annotation of the value at the position of the mouse cursor.